I don’t know why I have delayed this post for so long. Anyway, I am working on some workshop material and part of the workshop is RTC/EWM Work Item Attribute Customization using some simple JavaScript scripts. I often see questions about this type of attribute customization on the Jazz.net forum. Since it is pretty much impossible to remote debug scripts for others for various reasons, I want to provide some short introduction how anyone can use the built in Developer Tools of a Firefox or Chrome browser to debug the scripts.
Open the Project Area
Pick a browser. The latest Chrome or Firefox will do. Open the project area in the browser.
Debug mode
The JavaScript code is compressed when it is executed in the browser. To be able to see the scripts code as it is executed, it is necessary to enable the debug mode. This is done by injecting
?debug=true
into the URL used to access the CCM application. For example access the Work Items menu of the project area that has the attribute customization. Into the resulting URI below
https://elm.example.com:9443/ccm/web/projects/JKE%20Banking%20(Change%20Management)#action=com.ibm.team.workitem.viewWelcome
Inject ?debug=true in front of the hash # like so:
https://elm.example.com:9443/ccm/web/projects/JKE%20Banking%20(Change%20Management)?debug=true#action=com.ibm.team.workitem.viewWelcome
Make sure the page loads and the injected code is still showing in the URL.
Note: do not confuse ?debug=true with ?internal=true, which is for a completely different purpose (see the EWM Extensions Workshop the deployment lab).
Find the Scripts in Chrome
Once you have done that, open a context where the scripts would be available. For example create a work item of the specific type of interest that has the attributes.
For Chrome use the three vertical dot menu close to the profile, navigate to the More tools menu and then select the Developer tools menu.

The shortcut is CTRL+Shift+I.
The Developer tools can dock in different locations. You can control where you want it to be docked using the Developer Tools Dock side settings.

I have found the scripts in different locations over the years, at least I believe so. I really used to struggle to find them in Firefox. In Chrome it was really easy to spot, at least in my environment which made it my go-to debugging browser. This location has recently changed for some reason unknown to me. But this time I was able to locate the scripts in the folder top/<publicURIroot>/ccm/web/projects.
To locate the scripts select Sources and select Page if necessary. Then expand the folders until the scripts become available in the folder top/<publicURIroot>/ccm/web/projects. Where <publicURIroot> is the public URI root of you ELM server, that is encoded in the first section of the URL you have open just now.

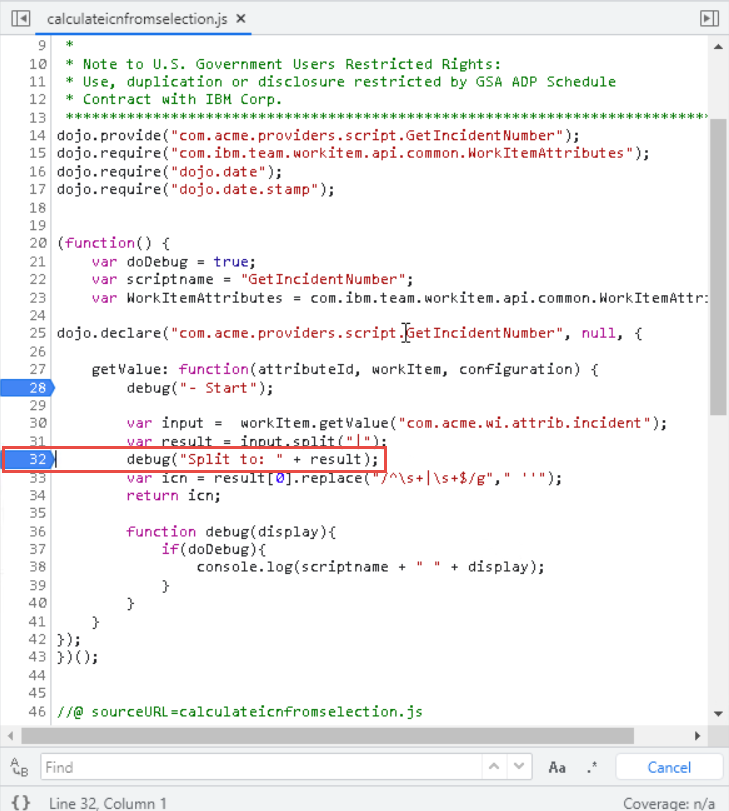
Click on the script you want to debug. The script opens in the editor and allows you to set breakpoints as shown in the image below.

This now allows you to step through the script and debug as well as inspect the code and the current values in the script instance. The next image shows the debugger pausing at a breakpoint of the script and the how to inspect the value of the parameter attributeId.

You can step over the script statement by statement and the debugger displays the values and call results in the debugger. This makes it as easy as it can get to understand what the script is doing and why (or why not).

Find the Scripts in Firefox
Open Firefox and open the project area you are interested in. Modify the URL like above with the ?debug=true statement. Navigate to the Work Item tab of the project area.
Open the application menu (three horizontal stripes on top of each other). Select More Tools and then select Web Developer Tools

The shortcut is also CTRL+Shift+I. You can control where the Web Developer Tools dock using the customization menu.

Dock the Web Developer Tools as you please. Then open the Debugger tab.

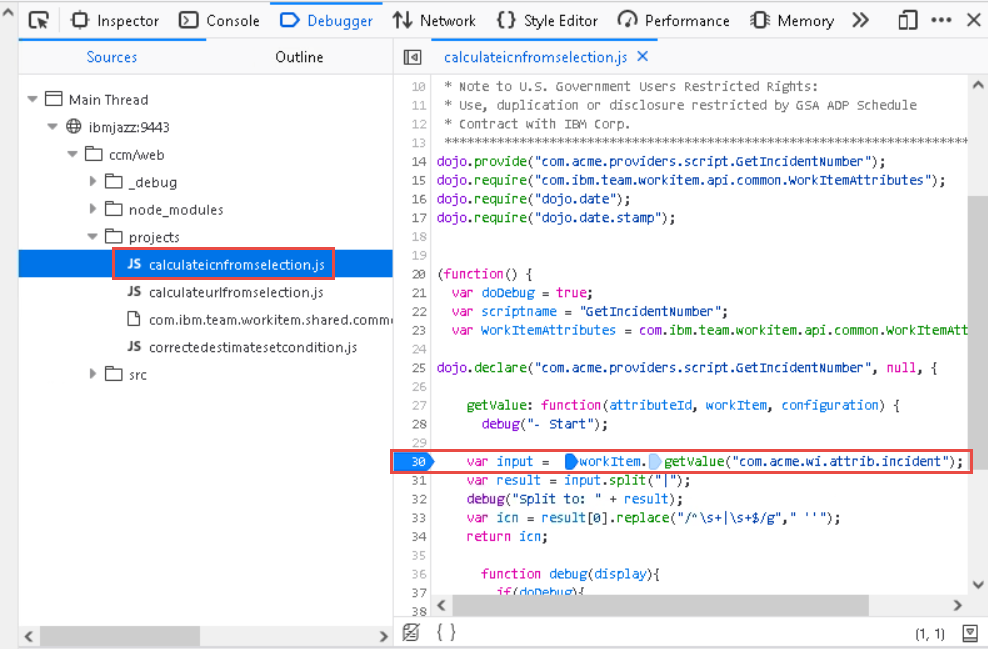
Unfold the nodes MainThread/<publicURIroot>/ccm/web/projects. Where <publicURIroot> is the same public URI root that we know and love.
Click at the script you are interested in to open it in the debugger. Place breakpoints as desired. This works exactly like it does in Chrome.

Create a new work item or open one with scripts you want to debug and use the Web Developer tools similar to the Chrome developer tools.
Possible Issues
You might run into issued if you try this. E.g. the projects folder does not contain any scripts. This can be the result of various reasons. Here what I have run into.
- Did you enable Attchment Scripts in the Advanced Properties of the CCM server?
- Check by using a default filled in example script. Maybe your script is too corrupted/wrong to be loaded. You might want to consider to check the log file if there are load issues.
- If you just changed the scripts and still see the old version, make sure to force a reload e.g. Using STRG+F5 or otherwise reloading the page to pick up the new process.
Summary
I am at a loss, why I have not published this so far. Better late than never, this is going to be my URL for questions in the future.
I hope this helps users out there to smooth their development for attribute customization scripts.
